Home » Digital Marketing and Advertising Blog » Tutorials » Google Analytics 4 Guide for Beginners
You have a website. You publish content, update services , share links on social media, and occasionally check how many visits you've received. So far, so good. But there's a much more interesting question than knowing whether 50 or 500 people visited yesterday: what did those visitors do, and what did they actually contribute to your business?
Because receiving traffic is not the same as getting results. You can have an article that attracts thousands of readers without generating a single sales inquiry, while a services page with far fewer visits can become your best source of clients. The difference lies in knowing how to interpret what's happening on your website.
That's where Google Analytics 4 (GA4) comes in, Google's analytics tool that allows you to know how users arrive at a page, what content they view, how they interact, and what actions they end up taking.
The problem is that opening Analytics for the first time can be quite confusing. Charts, percentages, events, sessions, dimensions, acquisition channels… Everything seems important, and at the same time, it's hard to find a simple answer to something as basic as knowing which page is performing best.
This Google Analytics 4 beginner's guide is designed precisely to avoid that problem. We'll learn how to set up GA4 step by step, navigate its reports, interpret essential metrics, and measure the actions that truly matter. We won't assume you're already familiar with the tool, but we also won't oversimplify it so much that you end up not knowing how to use it.
And remember this from the start: Google Analytics isn't for collecting pretty statistics. It's for helping you understand your website and improve it.
Google Analytics 4 is a digital analytics platform that collects and organizes information about user activity on websites and apps. Its goal is to help you understand how users discover your business, how they behave once they're on your site, and the extent to which they take the actions you want them to take.
It is the evolution of Universal Analytics, the old version of the tool, which stopped processing new data in its standard properties on July 1, 2023. GA4 introduced a major change in how it measures: instead of building everything around sessions and page views, it uses an event-based model.
And what exactly does it mean?
Imagine someone searches on Google for "web design agency in Granada," finds your page, and clicks to check out your services. Then they browse your portfolio, review some projects, and finally click the button to contact you via WhatsApp.
Google Analytics 4 can record different moments of that journey:
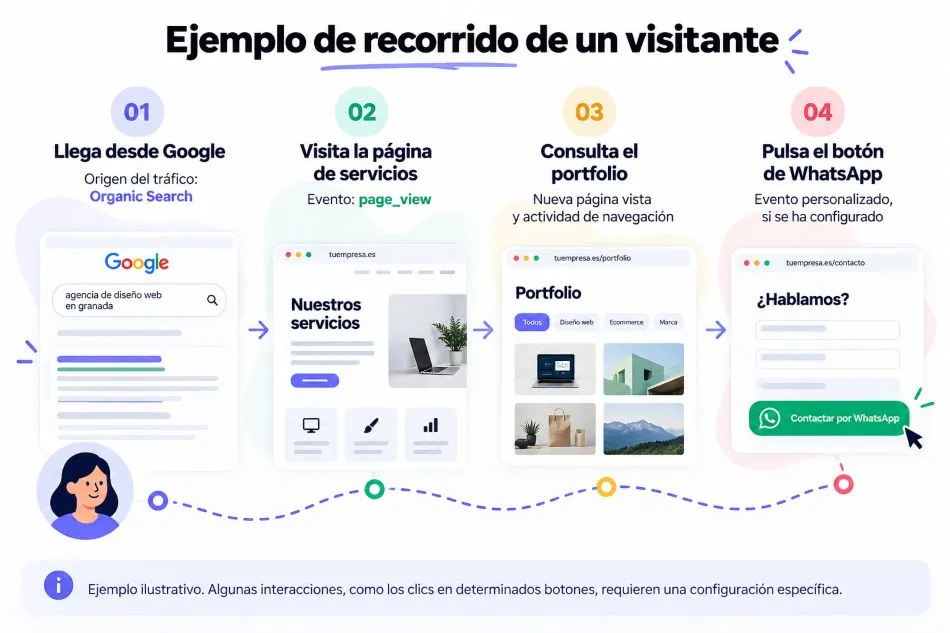
The interesting thing is not just knowing that a person has visited three pages. It's understanding which channel brought them there, what content sparked their interest, and whether they ultimately took a step towards hiring.
However, it's important to clarify something: GA4 is not a session recorder and does not allow for the personal identification of each visitor. It works with measurement data, permitted identifiers, events, and, in certain circumstances, statistical estimates. Furthermore, its results may be affected by consent, browser restrictions, or tracking blockers.
That's why it's more accurate to interpret their figures as information about the activity they were able to measure, not as an infallible record of absolutely everything that happened.
Although the tool offers many possibilities, for a small business, an ecommerce site or a corporate website, the key is to answer five questions.
Interrogatory | What can you analyze with GA4 |
|---|---|
How much activity does my website have? | Users, sessions, and page views |
Where do the visitors come from? | Google, social media, ads, referrals, and other channels |
What kind of content is of interest? | Pages visited, interaction and routes |
What do visitors do? | Events such as searches, downloads, or configured clicks |
What results can I expect? | Forms submitted, purchases, and other key events |
Let's take another example. An online store discovers that its visits from Instagram are increasing considerably. That seems like good news, right? However, upon reviewing its results, it finds that organic traffic from Google generates many more purchases, despite representing a smaller proportion of visits.
This information allows us to rethink the strategy: perhaps social media is effective in raising brand awareness, while SEO is attracting users with a clearer purchase intention.
Without Google Analytics, both sources might appear equally profitable if we only looked at visits. With proper measurement, we can compare their contribution to business objectives.
However, we shouldn't automatically attribute a sale to a channel without considering the attribution model used. The same person might discover the business on Instagram, return days later via Google, and ultimately make a purchase after receiving an email.
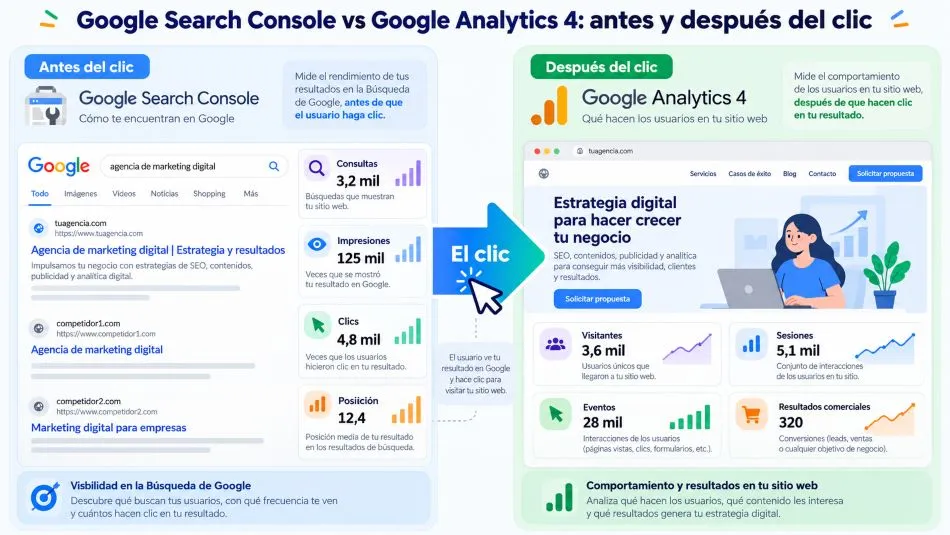
This is a common misconception when starting out with web analytics. Both tools are from Google, both provide information about a page's performance, and they can be used together, but they answer different questions.
Google Search Console focuses on your website's presence in Google's organic results: what searches generate impressions, how many clicks you receive from the search engine, and whether there are indexing problems.
Google Analytics 4, for its part, studies user activity within your website or application, always within the limits of the configured measurement.
Google Search Console | google analytics 4 |
|---|---|
Queries that generate impressions | Channels that originate the sessions |
Clicks from Google Search | Users and sessions measured |
Average position in results | Interaction with pages and content |
Indexing and crawling issues | Events, shopping, and other objectives |
Organic performance on Google | Multi-channel results |
What's truly useful is combining both perspectives. Search Console can show you that a page is getting a lot of clicks for a specific search. Analytics will help you investigate whether that traffic interacts with the content and ultimately takes a valuable action.
For example, if an article ranks very well but generates hardly any searches, you might not need to improve its SEO. The real problem may lie in the offer, the call to action, or the relationship between the content and the service you're trying to promote.
This distinction is especially important when working on your website's SEO. Attracting qualified traffic and converting it into business opportunities are related goals, but they require different metrics to be properly evaluated.
Before analyzing visits, campaigns, or conversions, we need to make sure that Google Analytics is properly connected to our website.
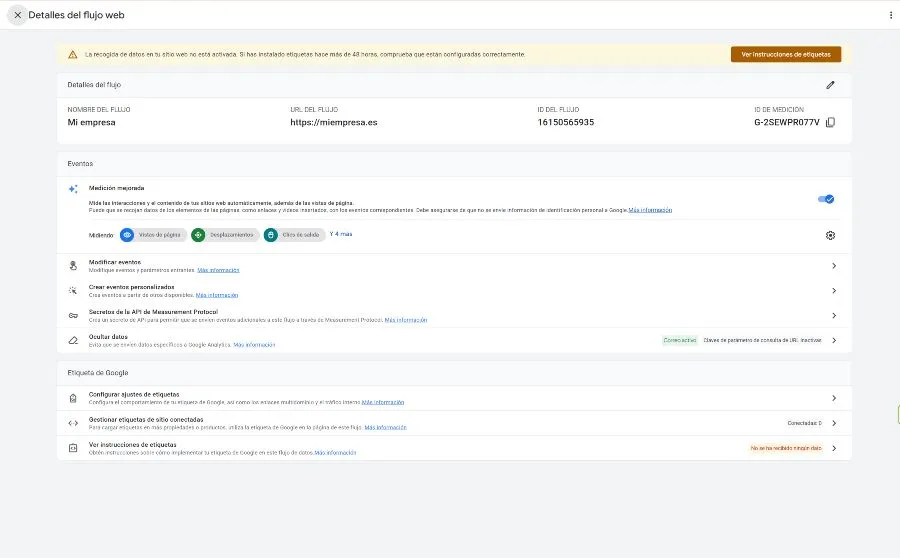
And here's a little catch: creating an account doesn't mean you're already measuring anything. For GA4 to start collecting data, you need to create a property, configure a data flow, and install the corresponding tag.
The process doesn't require advanced programming skills if you're using platforms like WordPress, although it's important to understand what you're configuring. An incorrect installation can lead to incomplete data, duplicate visits, or unreliable reports that will later influence your decisions.
Let's do it from scratch.
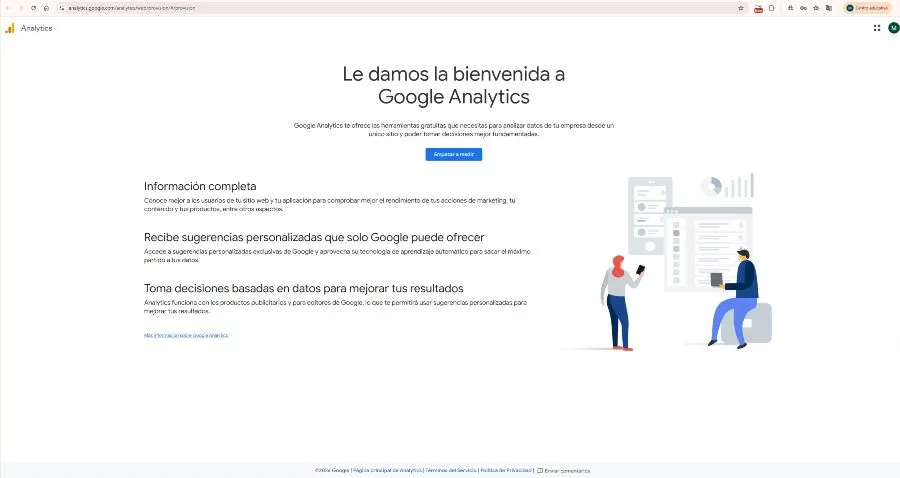
The first step is to access Google Analytics with a Google account. If you're not already using the platform, you'll find the option to begin setup. If you already have other accounts or properties, you can create a new one from the administration section.
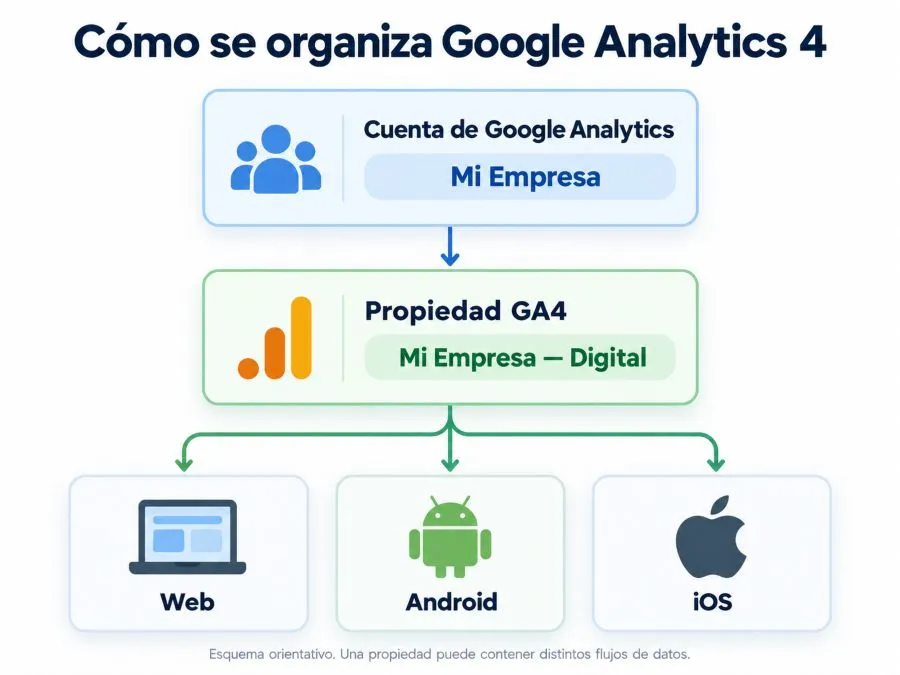
Although these concepts are often used interchangeably, it is important to differentiate them:
Account: Groups and manages one or more Analytics properties. You can think of it as the organizational level of your company.
Property: is the space where data from a website, application, or set of related platforms is collected, configured, and consulted.
Data flow: identifies a specific source of information, such as a website, an Android app, or an iOS app.
For a business with a single website, it's common to start with one account, one property, and one web data flow. If the business has multiple platforms, the structure may require more planning.
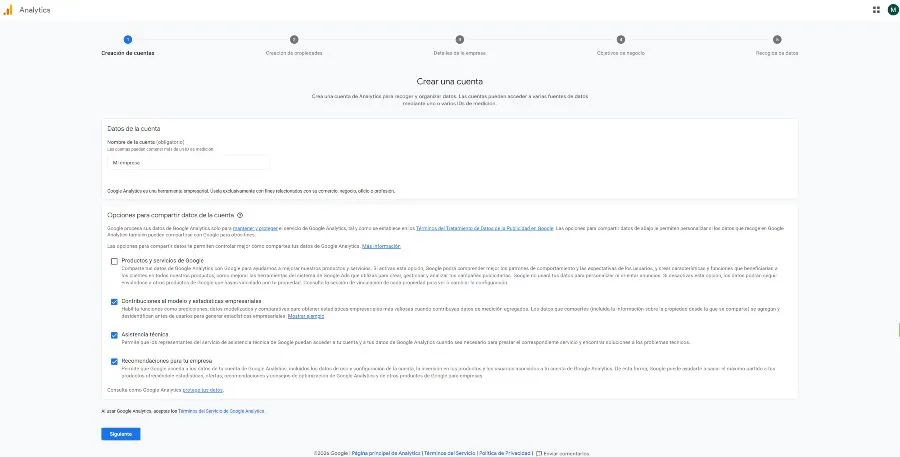
Step 1. Create the Analytics account
On the home screen, tap "Start measuring" or, if you already use Analytics, go to "Manage" and select the option to create an account.
Google will ask you for a name. It's recommended that you use the name of your company or project, especially if you're going to manage multiple websites.
You'll also find several preferences for sharing data with Google. Review their purpose before accepting them; you don't need to activate all the options just because they appear as selectable.
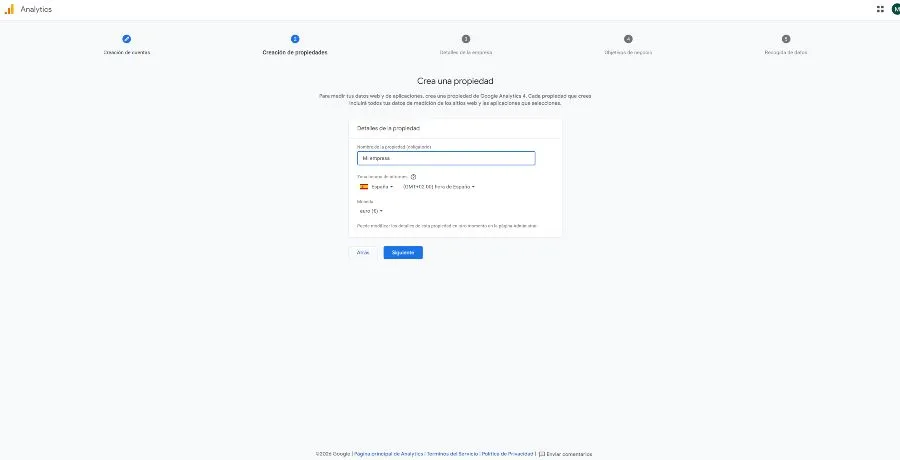
Step 2. Set up your Google Analytics property 4
Next, you'll need to enter the property name. You can use your website's business name for easy identification.
Pay special attention to two settings:
Time zone: If your business primarily operates in mainland Spain, select the one corresponding to Madrid.
Currency: Choose euros if you want to analyze amounts and economic results in that currency.
It may seem like a minor detail, but it has practical consequences. The time zone determines how data is grouped by day, while the currency influences the presentation of certain economic metrics.
If you compare Analytics revenue with your online store revenue and both platforms use different configurations, you may find discrepancies that have nothing to do with a sales problem.
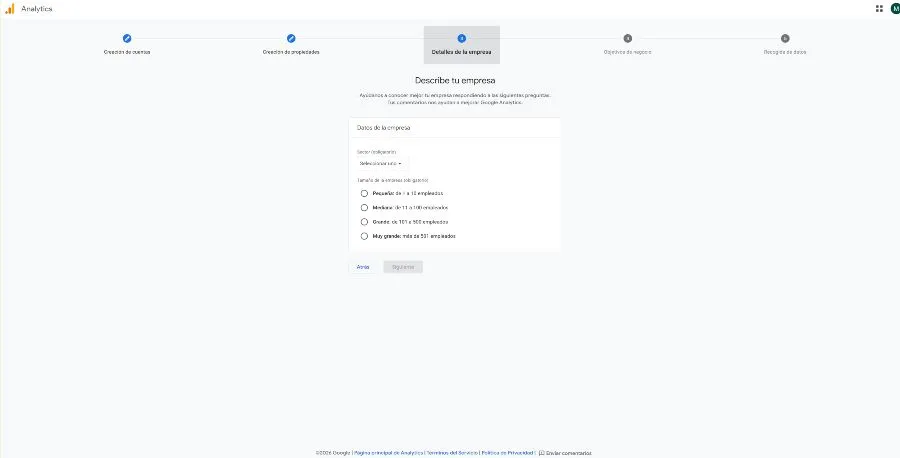
Step 3. Provide the basic information about your business
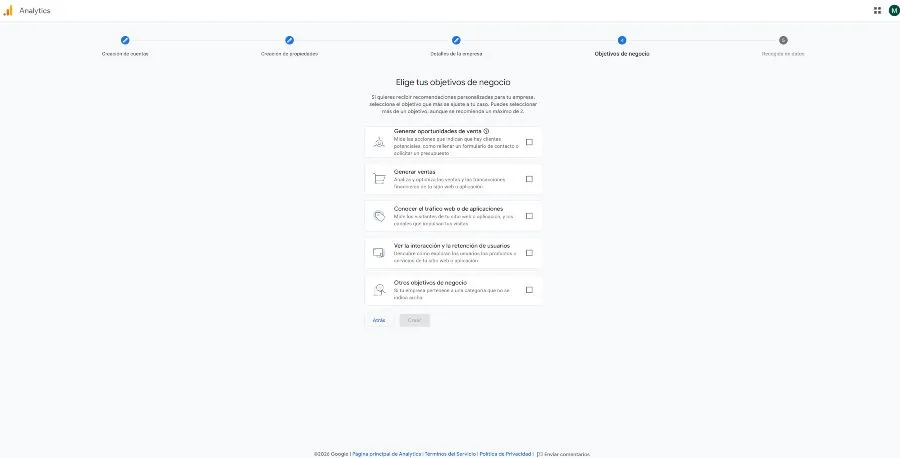
Google will request information such as the industry, company size, and the objectives for which you will use Analytics.
A corporate website might be interested in generating leads, while an online store will likely prioritize sales. Selecting these goals helps Google tailor some initial reports and options, though you can customize the settings later.
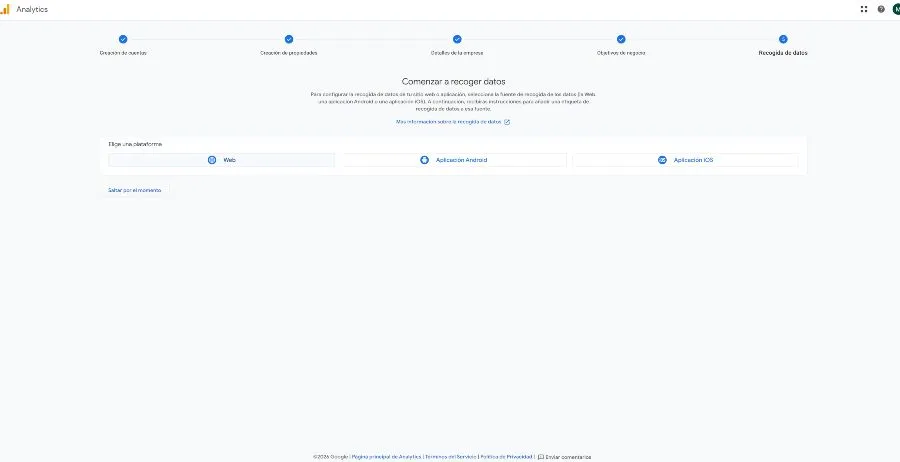
Step 4. Create a web data flow
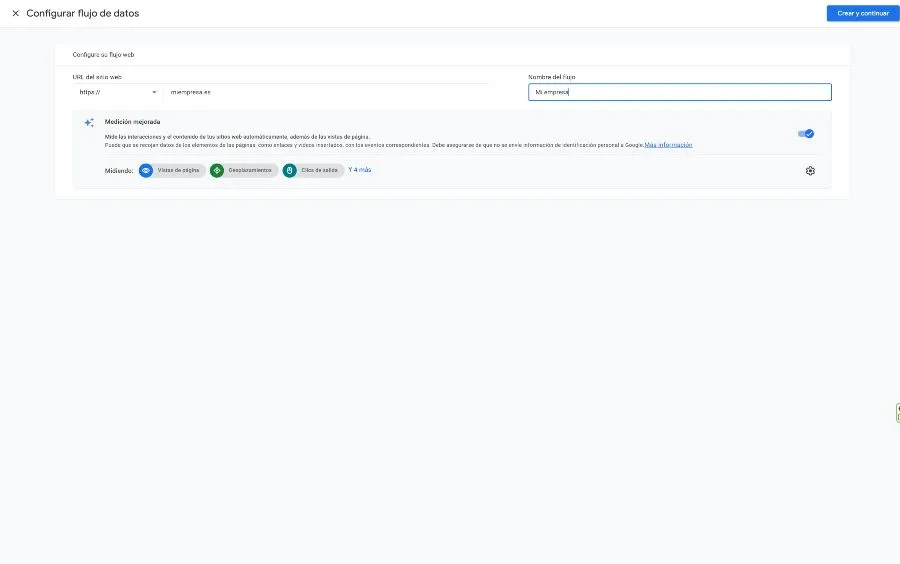
Once the property is created, select the "Web" option and enter your website address, for example https://www.tuempresa.es.
Give the flow a recognizable name and check out the enhanced measurement option, which allows you to automatically record certain events without configuring them one by one.
When you complete the process, GA4 will generate a measurement identifier in a format similar to this:
G-XXXXXXXXXX
This code is important because it allows you to associate the data sent from your website with the corresponding flow.
You shouldn't confuse it with the property's numeric identifier or with a Google Tag Manager container code, which begins with GTM-.
The steps above correspond to the configuration procedure that Google maintains in its official documentation.
We've already created the property and prepared our measurement identifier. Now we just need to connect Analytics to the website.
There are several ways to do this, and not all are equally convenient. The choice depends primarily on the technology your website uses and the level of control you need over the events.
For a simple website, a native integration might be sufficient. However, if you plan to measure forms, specific clicks, advertising campaigns, or purchase processes, you might want to consider using a tag management system like Google Tag Manager.
The important thing is to choose one method and avoid installing the same measurement multiple times.
Option 1. Install Google Analytics 4 on WordPress
If your site uses WordPress, one of the most accessible alternatives is to use Site Kit by Google.
This plugin allows you to connect various Google services directly from your WordPress admin panel. To use it, you'll need to install it, log in with the corresponding account, and follow the Analytics connection wizard.
Before completing the process, check if your website already has any active integrations. It's relatively common to find older installations where Analytics has been added via the theme, another plugin, or a manually inserted code snippet.
If you install a second label without checking the first one, you may cause duplicate measurements.
On a corporate website with forms, custom buttons, or advertising campaigns, managing GA4 through Tag Manager can also be advantageous. The choice should be based on the project's needs, not on the number of plugins that can be installed.
If you're building your website from scratch, it's worth considering analytics from the development phase. In our WordPress web design service , we work precisely with the idea of creating sites geared towards specific goals, not just presenting information.
Option 2. Install Google Analytics using Google Tag Manager (my favorite)
Google Tag Manager allows you to manage tags and specific events from a single container, without having to directly edit the website code every time you need to modify the measurement.
For a basic installation, the procedure involves creating a container, installing its code snippets on the website, and adding a Google tag associated with the GA4 measurement identifier.
Next, you will need to check its functionality using preview mode and publish the container changes.
The advantage becomes apparent when you need to measure specific interactions. Imagine you want to know how many users click a button to request a quote. With Tag Manager, you can configure a trigger to detect that interaction and send an event to Analytics, provided the website's technical specifications allow for accurate click identification.
However, Tag Manager doesn't magically detect every commercial action. A form might be submitted via AJAX, a button might execute JavaScript, or a purchase might be completed on an external platform. In those cases, the implementation will need to be adapted.
Option 3. Install the tag directly into your website's code
You can also manually insert the Google Analytics code into your page.
Within the GA4 data stream, you'll find the installation instructions, including the Google tag snippet. If you have access to the HTML code, you can incorporate it into your page headers following the official guidelines.
This alternative works, although it requires proper implementation and maintenance. On websites with templates, content management systems, or frequent updates, modifying theme files without a proper strategy can cause tracking to stop working.
That's why it's usually preferable to use a maintainable integration, especially when several people manage the website.
Once the tag is installed, don't consider the configuration complete. One crucial check remains: ensure that GA4 is receiving the expected events.
The easiest way to get started is to go to your website and open the "Real-time" report in Analytics. This report shows some of the activity recorded over the last 30 minutes, as well as specific events and pages visited.
If you've just installed the tag, Google indicates that it may take up to 30 minutes for the data collection to start appearing. For more precise debugging, you can use Tag Assistant or DebugView.
Try this simple test: open your website, browse through several pages, and review the report. If the implementation and consent terms allow for measurement, you should be able to see activity consistent with your visit.
But be careful: the appearance of an active user does not guarantee that the entire configuration is correct.
In a minimally rigorous review, it is also advisable to check that page views are not being sent twice, that events have consistent names, that important pages are not missing, and that tags respect visitors' consent decisions.
This last point is especially relevant for companies operating in Spain. Installing Analytics does not replace privacy obligations, nor does it automatically make tracking legal. You must have an appropriate consent mechanism, correctly configure tags, and verify how they behave when a visitor accepts or rejects analytics cookies.
Google offers a system called Consent Mode, with basic and advanced settings, which adapts the behavior of its tags based on the level of consent. Its technical implementation does not eliminate the need to comply with applicable regulations.
You've already installed Google Analytics 4 and verified that it's receiving information from your website. Now it's time to use it. And this is where many beginners discover that installing the tool was probably the easiest part.
You open the Analytics panel and numbers appear everywhere: active users, sessions, events, percentages, acquisition graphs, page views… There is so much data available that it is tempting to start pressing buttons without knowing exactly what you are looking for.
The problem isn't that Google Analytics 4 is particularly complicated, but rather that it's designed to answer many different questions. An online store wants to know which products generate the most revenue, a service company needs to know where its quote requests are coming from, and a blog might be more interested in discovering which content attracts readers.
They all use the same tool, but they don't need to consult the same reports.
Therefore, before learning how to use Google Analytics 4, it is advisable to slightly change the way you approach it: it is not about memorizing all its menus, but about identifying what information you need to answer a specific question.
If you want to know where your visitors are coming from, you'll look for acquisition data. If you need to discover which pages they're viewing, you'll turn to engagement reports. And if you're interested in knowing how many users end up buying or contacting you, you'll need to analyze the key events you've set up.
Most of these answers can be found within the Reports section, located in the GA4 navigation menu. From there you can access different collections of reports, although their organization may vary depending on the objectives selected when configuring the property and the customizations made.
To begin, let's focus on four key areas:
What do you want to discover? | Where to search in GA4 | What will you learn |
|---|---|---|
How many people use your website | General reports and acquisition | Differentiate users, sessions, and visits |
Where does the traffic come from? | Traffic acquisition | Identify search engines, ads, networks, and references |
What content works | Pages and screens | Analyze which pages generate interest |
What do visitors do? | Interaction and event reports | Identify measured actions, clicks, and behaviors |
There is a distinction you should also know from the beginning: in Google Analytics you will find dimensions and metrics.
Dimensions describe the characteristics of the data. For example, the visitor's country, the acquisition channel, or the title of the page viewed. Metrics, on the other hand, express quantities: number of users, sessions, events, or revenue.
If a report indicates that the Organic Search channel has generated 1.200 sessions, "Organic Search" is the value of a dimension and "1.200 sessions" is the metric.
Understanding this will allow you to read Analytics tables much more easily. Instead of encountering a collection of seemingly unrelated columns, you'll begin to recognize how they relate to one another.
And don't worry about mastering the entire tool from day one. A company that correctly interprets five relevant metrics can get much more out of GA4 than one that consults twenty charts without a clear understanding of what they mean.
One of the first questions we usually ask ourselves when we log into Google Analytics is how many visits our page has received. It seems simple, but GA4 distinguishes between different metrics that don't always mean the same thing.
The most important ones to start with are users, new users, and sessions.
Users represent individuals or user identities differentiated by Analytics, based on available identifiers and property settings. They should not be interpreted as an exact count of natural persons, because the same person may use multiple devices, reject cookies, or browse in ways that prevent them from being recognized between visits.
Furthermore, when GA4 simply displays the "Users" metric in many standard reports, it typically refers to active users. Therefore, we shouldn't assume it includes all users who have triggered any event.
Sessions, on the other hand, represent periods of activity. The same person can start several sessions at different times, so it is common to find more sessions than users.
Imagine a potential client visits your web design page on Monday to inquire about your services. On Wednesday, they return because they want to review some projects from your portfolio, and on Friday, they come back again to request a quote.
Assuming Analytics can recognize her as the same user, we would have one user identity and three distinct sessions.
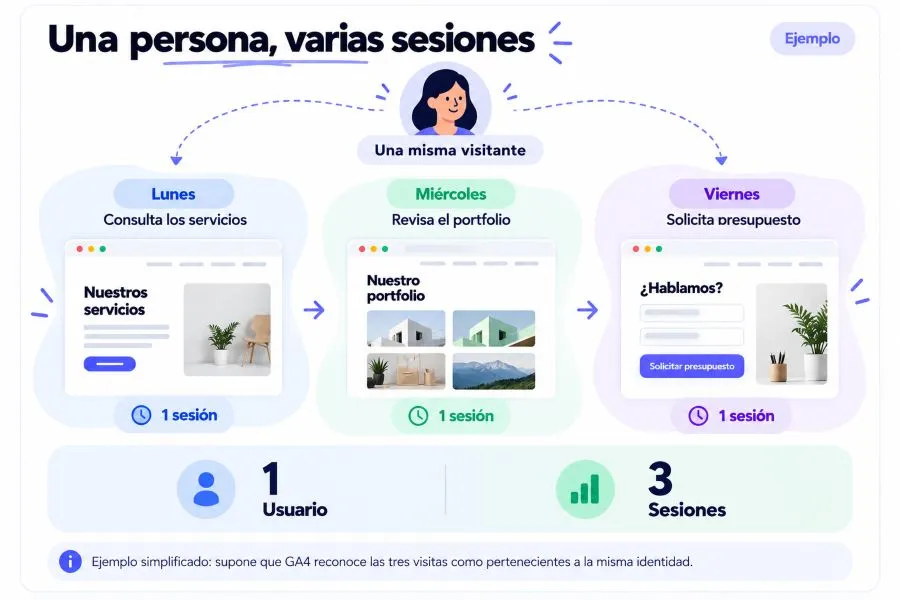
This example helps to understand why it is not correct to use the terms users, sessions, and page views as if they were interchangeable.
A session can include multiple page views. If someone enters your website, reads an article, opens the contact page, and visits other content without ending their session, these actions can be counted as separate views within the same activity period.
A session begins when a user opens a website or application and there is no other active session.
By default, GA4 considers a session to have expired after 30 minutes of inactivity, although this period can be modified in the settings.
For example, if a person enters your website at 10:00, views several pages and stops interacting, a new activity after more than 30 minutes of inactivity can start another session.
However, if you navigate from one page to another without exceeding that idle time, the interactions will normally belong to the same session.
Unlike in Universal Analytics, the change from one day to the next does not automatically trigger a new session in GA4. Similarly, the appearance of a new campaign during an active session does not automatically restart the existing session.
It's important to know this difference if you're comparing old statistics with current ones, since you can't always directly compare the results from both versions of Analytics.
Another interesting distinction is that between new visitors and returning visitors.
New users are those whose first visit or application opening was detected during the analyzed period. Returning users are those that GA4 recognizes as visitors who had previously used the website or application.
This information can help you understand how your audience evolves.
Let's consider a specialized blog that publishes informative articles every week. If a significant proportion of its readers regularly return, it could be a sign that the content remains interesting and that there is a certain level of reader loyalty.
On a services page, however, it doesn't always make sense to pursue a high percentage of returning visitors. A user might discover the company, hire what they need, and not revisit the website for months. And that doesn't mean the strategy has failed.
The important thing is to interpret the data according to the function of each page and the business objectives.
In an initial review, we recommend paying attention to these four:
Metric | What does it tell you? | How to interpret it |
|---|---|---|
Active users | User identities with logged activity | It helps to assess the scope |
new users | Users detected for the first time | It provides guidance on recruitment |
Sessions | Recorded periods of activity | Shows the frequency of visits |
Sessions with interaction | Sessions that meet certain interaction criteria | It provides context about web usage |
Sessions with interaction deserve a special explanation, because they are one of the most useful metrics in Google Analytics 4.
A session is considered to have interaction when it meets at least one of these conditions: it lasts more than 10 seconds, it records a key event, or it contains two or more page or screen views.
This allows us to differentiate, using a criterion established by Google, the sessions that show certain signs of activity from those that do not.
But it's also important not to overstate its significance. Someone can find your company's phone number in five seconds, jot it down, and leave. That might not constitute an interactive session, but their visit could have been extremely valuable commercially.
The metric is a clue, not a verdict.
Therefore, when reviewing your website statistics, try to observe how users, sessions, and overall interaction are evolving. A drop in visits can be worrying, but if it coincides with an increase in qualified leads, you'll need to investigate what happened before concluding that performance has worsened.
Knowing how many people visit your website is good. Discovering how they find you is much more interesting, especially if you're investing time or money in digital marketing.
The Google Analytics 4 Traffic Acquisition report allows you to analyze the origin of your sessions. In other words, it helps identify which channels are bringing visitors to your site and how they behave during those visits.
To view it, go to "Reports" and look for "Traffic Acquisition" within the relevant collection. In many properties, it appears in the "Acquisition" section, although the exact location may vary depending on how the navigation is customized.
The main table typically organizes sessions using the "Session Default Channel Group" dimension. This means that Analytics groups traffic into categories such as organic search, paid search, direct access, social media, and other sources.
Although their names usually appear in English, understanding them is not too mysterious when we relate them to real situations.
Canal | Where does the traffic come from? |
|---|---|
Organic Search | Non-advertising search engine results |
Paid search | Search engine ads |
Directly | Traffic to which GA4 does not assign another identified source, among other cases |
Referral | Links from other websites |
Organic Social | Organic traffic from social media |
Paid Social | Advertising campaigns on social networks |
Email | Email campaigns correctly identified |
Imagine you publish an article about how to improve WordPress speed and start receiving visits from Google. Those sessions could appear within Organic Search.
If another specialized website recommends your article via a link, its visits could be classified as referrals. And if you share that content through a properly tagged newsletter, you can analyze the traffic generated from email.
Each channel provides information about a part of your acquisition strategy.
However, there is one mistake that should be avoided: thinking that everything that appears in Direct corresponds to people who voluntarily wrote your web address.
Direct traffic can also include sessions whose origin could not be accurately determined. For example, some applications, links without reference information, or measurement configurations can lead to this classification.
Therefore, a sudden growth in Direct does not necessarily mean that your brand has become much better known.
Within GA4 you will find two reports whose names are very similar, but which answer different questions.
The User Acquisition report examines the channel through which new users were initially acquired. In contrast, the Traffic Acquisition report focuses on the origin of sessions, including both new and returning users.
Imagine this route:
A person discovers your company on Google on Monday. On Thursday, they visit your website through a newsletter, and a few days later, they revisit it via a link shared on social media.
The user acquisition report may list Google as your primary acquisition channel, while the traffic report analyzes the origin attributed to your various sessions.
It should also be considered that GA4 applies attribution rules to sessions, so the ranking does not always literally correspond to the last link the visitor clicked on.

Let's look at a practical example. Suppose a service company obtains the following results during one month:
Canal | Sessions | Sessions with interaction | Key contact events |
|---|---|---|---|
Organic Search | 2.400 | 1680 | 48 |
Paid search | 1200 | 900 | 36 |
Organic Social | 1800 | 630 | 9 |
Directly | 700 | 490 | 21 |
Referral | 300 | 240 | 12 |
At first glance, Organic Search seems like the most interesting channel because it generates the highest number of sessions and contacts. Paid Search also stands out for its ability to generate results, although advertising expenditures should be analyzed before assessing its profitability.
On the other hand, Organic Social attracts a considerable volume of traffic, but generates fewer leads in proportion to its sessions. This doesn't necessarily mean that social media is performing poorly. Its primary role may be to increase brand awareness or reach people who aren't yet ready to buy.
What we wouldn't do is abruptly eliminate all activity on social media because a chart indicates that visits are converting less.
First, we would study the user's intent, the pages they visit, the type of campaign, and how key events are attributed.
That's the true value of interpreting Google Analytics 4: not finding a winning number, but understanding which channels contribute to the different business objectives.
When you share links in advertising campaigns, newsletters, or other marketing actions, you can add UTM parameters to the URLs.
These parameters help to identify the origin of visits more accurately and allow to differentiate campaigns that might otherwise end up grouped under the same channel.
For example, a labeled address might have this structure:
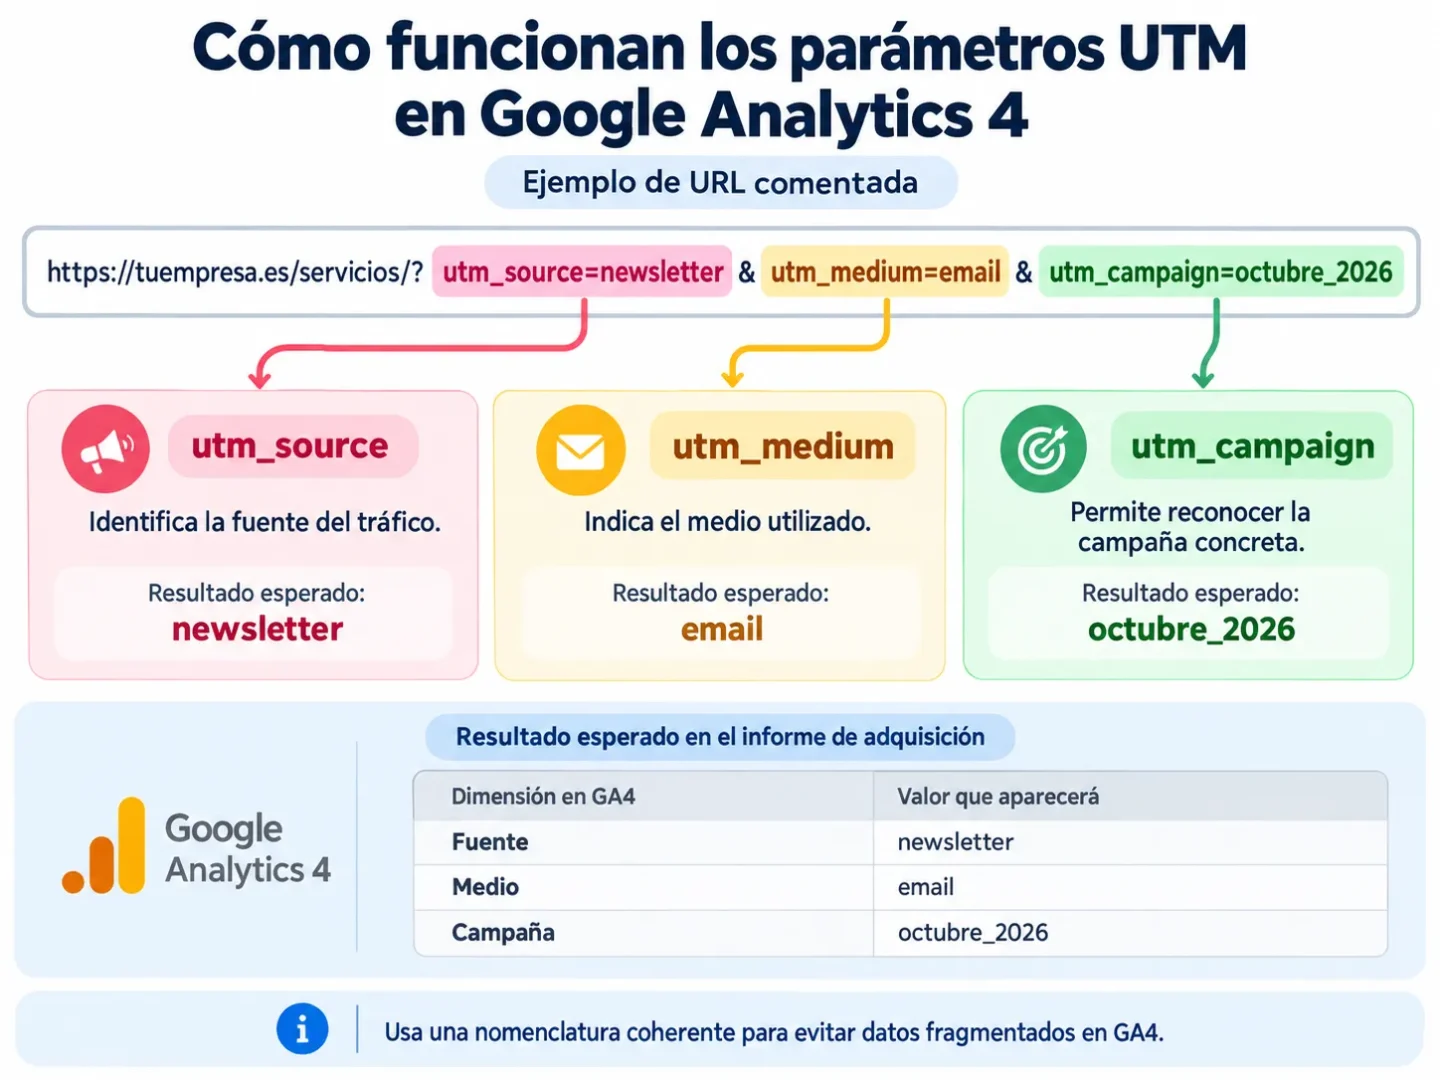
https://tuempresa.es/servicios/?utm_source=newsletter&utm_medium=email&utm_campaign=octubre_2026
In this case, utm_source Identify the source, utm_medium indicates the medium and utm_campaign allows you to recognize the specific campaign.
You don't need to memorize those parameters. The important thing is to understand why they are useful and to maintain consistent terminology: sometimes use one term and sometimes use another. Email, Other email and other correo It can fragment the data and make comparisons difficult.
You can build these URLs with Google's Campaign URL Builder.
You should also avoid adding UTM parameters to internal links on your own website, as this can alter acquisition information and hinder session analysis.
One of the most interesting features of Google Analytics 4 is discovering which parts of your website receive the most attention. And we're not just talking about identifying the most-read articles, but understanding which content attracts visitors, which content manages to maintain their interest, and which content leads them to take a specific action.
To view this information, go to Reports → Interaction → Pages and Screens. If you cannot find the report, the corresponding collection may not be published or your property's navigation may have been customized.
This section displays the activity recorded on the different pages of your website. By default, you can find information organized by the title of each page, although it is also possible to work with dimensions related to their paths or URLs.
It is worth clarifying here: a page appearing among the most visited does not necessarily mean that it is one of the most effective.
Imagine you own a renovation company and publish two pieces of content. The first, "10 Ideas for Decorating a Small Living Room," receives 8.000 views per month. The second, "How Much Does It Cost to Renovate a Kitchen in Granada?", barely reaches 900.
Apparently, the first one works much better. But what happens if the article about kitchen renovations generates 18 quote requests and the one about decorating barely gets one?
The second piece of content is probably providing more business opportunities, even though it has much less traffic.
This is one of the great lessons we must learn when interpreting Google Analytics 4: the popularity of a page and its profitability are two different things.
Within the pages and screens report you will find several metrics that are worth knowing.
Views show how many times pages or screens have been viewed, including repeat visits. If a person views the same article three times, three views may be recorded.
Active users allow you to know how many different user identities have been active on that content within the selected period.
Average interaction time, on the other hand, indicates how long a page has remained in the browser's foreground, relative to active users. It should not be confused with the total time spent on a page from when someone opens it until they leave it.
This last point is important. If someone opens your article, switches to another tab, and comes back ten minutes later, it doesn't necessarily mean they spent those ten minutes reading it. Google Analytics uses activity signals to calculate engagement time.
The main metrics can be summarized as follows:
Metric | What does it measure? | What can it be used for? |
|---|---|---|
Visualizations | Number of times a page has been viewed | Identify popular content |
Active users | Active users associated with that page | To know its scope |
Average interaction time | Average foreground activity time per active user | Evaluate attention signals |
Number of events | Events recorded and associated with the content | Analyze interactions |
key events | Significant actions recorded | Study the contribution to objectives |
However, these metrics should not be interpreted in isolation.
A 3.000-word article with an average engagement time of 20 seconds might indicate that the content isn't meeting visitors' expectations. But it could also have an introduction that immediately answers the user's main question.
In contrast, a contact page with a reduced interaction time can be working perfectly if users quickly find the phone number they need.
There is no universal interaction time that makes content good or bad. Its interpretation depends on the type of page, the search intent, and the expected visitor behavior.
Let's assume you have a corporate blog and want to decide which articles you should update during the next month.
Instead of choosing the oldest ones or those that receive the fewest visits, you can use Google Analytics reports to set priorities.
For example:
Content | Visualizations | Average interaction time | Initial reading |
|---|---|---|---|
How to create an online store | 3.200 | 2 min 45 s | Good level of service |
What is the Local SEO | 2.800 | 35 s | It is worth investigating |
Common mistakes in WordPress | 1.100 | 3 min 10 s | Interesting interaction |
How much does a website cost? | 900 | 2 min 20 s | Commercial potential |
The article on local SEO deserves a review. It has a fair amount of traffic, but its engagement time is lower than other content. Before making any changes, we would check if there is indeed a problem by comparing search intent, traffic sources, devices used, and subsequent actions.
Perhaps the title promises a comprehensive guide, but the reader finds the explanation too superficial. Or maybe the page is slow to load, uncomfortable to use on a mobile device, or doesn't directly answer the main question.
But we shouldn't draw any conclusions from that just by observing 35 seconds in a table.
It would also be interesting to analyze the article about website pricing. Although it receives fewer visits, it addresses a topic closely related to potential hiring. If it includes a suitable call to action and generates quote requests, it could become one of the company's most valuable pieces of content.
Ultimately, it's not about updating for the sake of updating. It's about identifying opportunities and verifying whether the improvements generate results.
This nuance is especially useful for those who work in SEO positioning.
The page and screen report shows the content that users view during their browsing, regardless of whether they arrived directly at that page or accessed it from another section of the website.
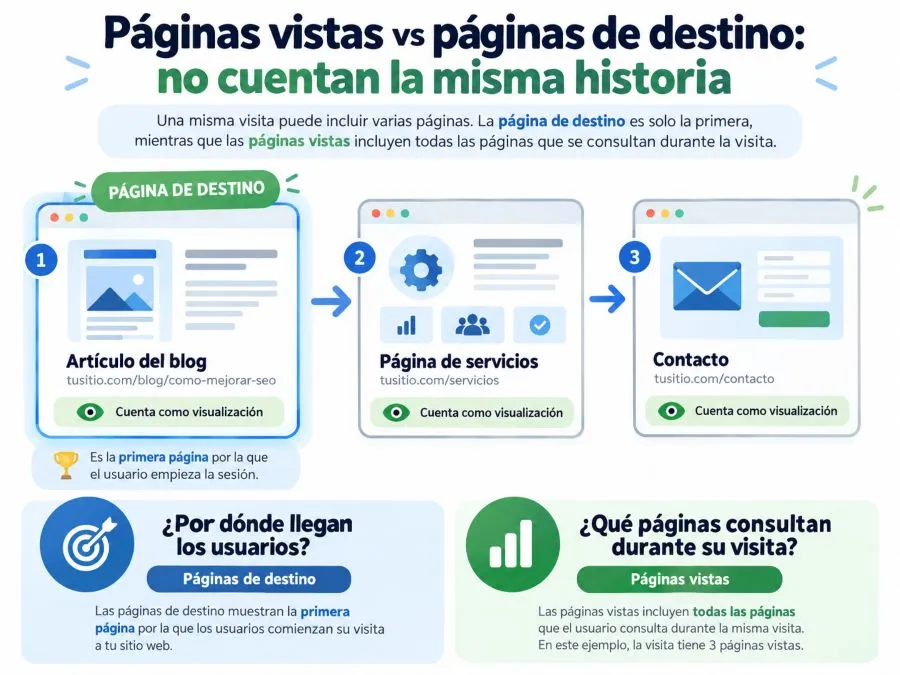
The Landing Pages report, on the other hand, focuses on the pages where sessions began.
Imagine that a visitor arrives from Google to an article about web design, then consults your portfolio and finally opens the contact page.
All three pages may appear in the Pages and Screens report. However, the landing page for that session will be the initial article.
Why does this difference matter?
Because if you want to analyze which content is attracting traffic from outside your site, landing pages offer a particularly useful perspective. However, if you need to understand which sections of your website receive attention during navigation, the Pages and Screens report is more appropriate.
And if you want to discover what happens between one page and another, you can use route explorations, which allow you to study navigation sequences and locate possible drop-off points.
So far we've learned how many people visit our page, where they come from, and what content they view. But we're still missing a crucial piece: discovering what they actually do while browsing.
This is where Google Analytics 4 events come into play, one of the most important concepts in the entire tool.
An event is an interaction or occurrence that GA4 records to describe what happens on a web page or application.
This could be a page visit, an internal search, a download, a click on an external link, or a purchase. The key is to understand that not all of these actions are automatically recorded and that some require specific implementation.
For example, Analytics can detect that a user has visited your contact page, but that doesn't mean it knows if they have successfully submitted the form.
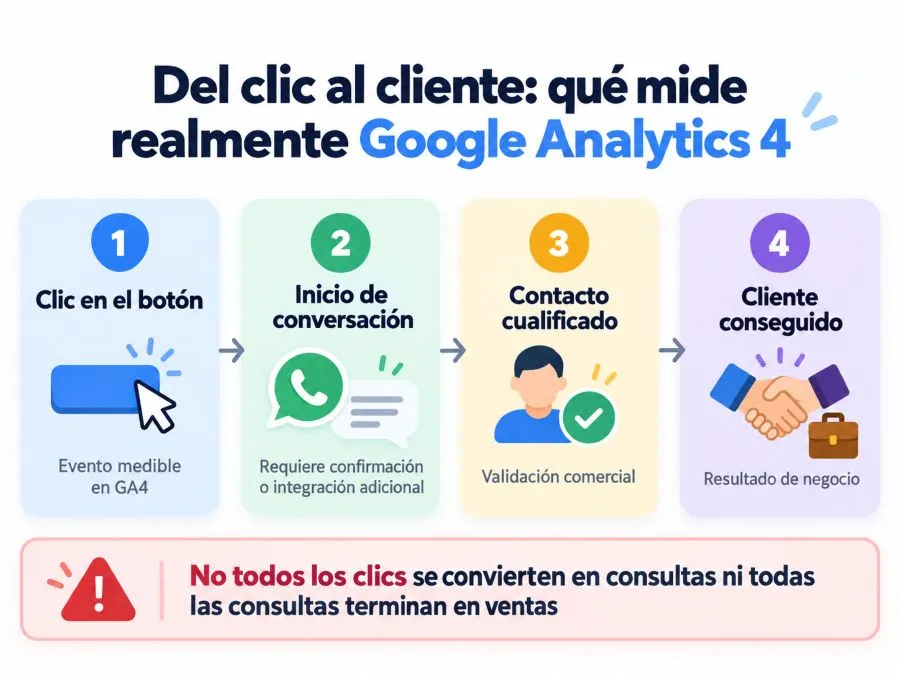
Similarly, someone pressing a button to open WhatsApp doesn't mean they've started a conversation or ended up hiring your services.
Measuring an interaction and measuring an outcome are different things.
Google Analytics 4 distinguishes four major categories of events.
Event type | How it works | Example |
|---|---|---|
Automatically registered | GA4 includes it without any additional specific implementation. | session_start |
Improved measurement | It is recorded using enabled enhanced measurement functions | scroll down |
Recommended | You must implement it following names defined by Google | generate_lead |
Personalized | You define it for the specific needs of your project | click_whatsapp |
Automatically recorded events are part of the basic functionality of Analytics. Other events, such as file downloads, internal searches, or certain external clicks, can be collected through enhanced measurement, provided it is enabled and its technical conditions are met.
Recommended events use names and parameters defined by Google for common situations. Finally, custom events allow you to record specific actions for which there is no suitable automatic or recommended event.
The idea is simple: you don't need to schedule an event for absolutely everything, but you also can't expect GA4 to understand on its own what the relevant interactions are for your business.
Although Analytics has numerous events, these are especially useful for familiarizing yourself with how it works:
Event | What does it represent? |
|---|---|
page_view | Page display |
session_start | Start of a session |
first_visit | First visit detected on a website |
user_engagement | User interaction signals |
scroll down | Achieve approximately 90% of the vertical depth of a page |
click | Click on an outbound link, under enhanced measurement conditions |
file_download | Click on specific download links |
view_search_results | Displaying internal search results when detectable |
There is one particularly interesting detail about the event scrollAlthough its name might suggest that it measures any displacement, the default behavior of enhanced measurement is to record when the visitor reaches the approximate threshold of 90% vertical depth.
Therefore, it doesn't automatically tell you if someone has read 25%, 50%, or 75% of your article. To measure those levels, you would need a different setup. And even then, scrolling to a specific position doesn't prove that the user has read all the content.
Imagine you have a service company and you set up a custom event called click_whatsapp to record every time someone presses your contact button.
At the end of the month, Analytics shows 85 events.
Does that mean you've acquired 85 potential clients? Not necessarily.
The same person can press the button multiple times. Some users may open WhatsApp and close the application without writing any messages. Others might send an inquiry, but never actually make a purchase.
The event lets you know how many times that interaction has been recorded. It doesn't, by itself, prove that 85 actual conversations took place.
To properly assess its usefulness, you would have to compare it with the inquiries received and, if your sales process allows it, with the customers you have ultimately acquired.
The same applies to forms. Measuring a click on the "Submit" button is not the same as measuring a successfully completed form. If the visitor forgets to fill in a required field, the click may occur without any request being submitted.
Therefore, whenever possible, it is preferable to record the confirmed success of the shipment.
To study the events, you can refer to the interaction reports available on your property or to the events section of the settings and administration, depending on the task you need to perform.
It is also possible to view specific events in the real-time report and use DebugView to check a specific implementation.
When reviewing the number of events, remember that a high count doesn't always indicate higher quality visits. A single session can produce numerous automated events.
For example, visiting five pages, logging in, and generating interaction signals can lead to multiple registrations without any commercial action taking place.
Therefore, instead of simply observing the total number of events, it is worthwhile to identify which ones are related to specific objectives: contact requests, purchases, registrations, downloads of relevant documents, or any other action that makes sense for your business.
That selection will be precisely the basis of the next step: measuring conversions and results through key events.
So far, we've learned to identify how many users visit our website, where they come from, which pages they visit, and how they interact with them. That's a lot of information, but we still need to answer the question that probably interests any company the most: Are all those visits actually making a difference?
Because a website can receive thousands of users per month and not generate a single business opportunity. The opposite can also happen: a company with relatively modest traffic can receive enough quote requests to keep its schedule full for weeks.
In both cases, focusing exclusively on the number of visits would give us a rather incomplete view.
This is where conversion tracking in Google Analytics 4 comes in. Its purpose is to help us distinguish between users who simply browse and those who take actions relevant to the project's objectives.
Imagine you run a consulting firm. Over the past month, your website has registered 4.000 sessions. The number seems promising, but it doesn't tell us much about your business's performance. However, you discover that 65 visitors submitted a contact form, 28 clicked the link to call, and 14 requested an appointment.
Now we're starting to get information that allows us to assess how the page is performing. However, we must be careful: the same person could have performed several of these actions, and tapping a phone number doesn't guarantee that the call was completed.
Specifically, a good Google Analytics setup consists of defining what we want to measure, recording those actions correctly, and understanding what the results represent.
We don't need to turn every mouse movement into a statistic. We need to identify the interactions that actually provide useful information.
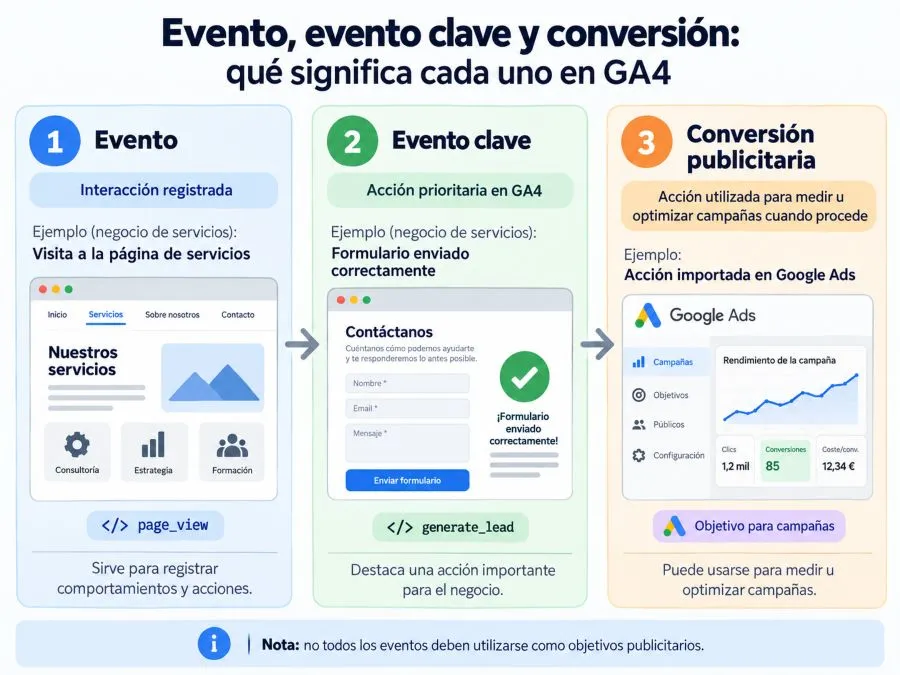
If you've consulted older Google Analytics tutorials, you've probably come across many references to "conversions." For quite some time, that was the term used in GA4 to identify particularly important actions.
However, Google changed this terminology in 2024 to better differentiate Analytics measurement from conversions used in Google Ads.
Currently, key GA4 events are those events we identify as particularly important to our business objectives. The term "conversion" is used more specifically for certain actions related to advertising measurement and optimization, although in digital marketing it's still common to talk about conversions in a general sense.
The difference seems like a simple name change, but it has a practical explanation.
In Google Analytics, we can consider it important when a person completes a quote request form, registers on a platform, or ultimately purchases a product. These actions can be measured through events and marked as key events to analyze their performance.
When working with Google Ads campaigns, we also need to decide which actions should be used as conversions to evaluate and optimize advertising. Not all interactions we want to study in Analytics necessarily need to become advertising bid targets.
For someone learning to use Google Analytics 4, the key takeaway is this: all key events are events, but not all events need to be key events.
Let's think about an online store for decoration products.
A visitor enters a product page, views several photographs, adds the item to the cart, and finally completes the order.
During that journey, various events can be recorded. Some are used to understand user behavior, while others represent a commercial outcome.
For instance, view_item This indicates that someone has viewed a product. add_to_cart It registers that you have added it to your cart. begin_checkout It signals the start of the payment process and purchase This represents the completed purchase, provided that the implementation successfully sends the event.
All four are interesting, but they are not of equal value.
Viewing a product is a sign of interest. Adding it to the cart means moving forward in the purchase process. Completing the order, however, represents the main objective of e-commerce.
Therefore, a reasonable configuration could log all those events and flag them. purchase as the main key event.

Could you also mark add_to_cart as a key event? Technically, yes. However, you should first ask yourself why you want to do it.
If your primary goal is to sell, filling shopping carts doesn't equate to making sales. An e-commerce business can experience significant growth in items added to carts without increasing revenue, especially if there are any issues during the checkout process.
This doesn't mean that intermediate actions are unimportant. They are crucial for identifying where difficulties arise. What should be avoided is mixing actions of different value and presenting their sum as if they were all equivalent business results.
Not all businesses need to measure the same things. The objectives of an online store are different from those of a clinic, a professional office, or a specialized blog.
Therefore, before configuring events, it is worth asking what needs to happen for us to consider that the website is fulfilling its function.
Project Type | Recommended main key event | Other useful interactions |
|---|---|---|
Service company | Successful submission of quote request (generate_lead) | Phone clicks, WhatsApp and service inquiries |
Online store | Purchase completed | Add to cart, proceed to checkout and view products |
online academy | Registration completed (sign_up) or purchase of a course | Visits to courses and requests for information |
Booking website | Confirmed reservation (purchase or other appropriate event) | Start booking and check availability |
Specialized blog | Subscription completed (sign_up) if that is your goal | Downloads, affiliate clicks, and content interaction |
Local business | Contact request completed (generate_lead) | Clicks on phone, map or directions |
Google's recommended event names allow for the standardization of certain actions, such as generate_lead, sign_up o purchaseTheir availability in reports depends on their correct implementation, including the corresponding parameters when necessary.
Note that we have indicated a main event for each type of project, but not all of them have to be configured in the same way.
In a clinic, for example, we may be interested in measuring appointment requests, although we should not send diagnoses, symptoms, patient identification data, or other sensitive information to Analytics.
On an affiliate website, a click to an external store indicates commercial interest, but it doesn't prove that a purchase has been made. To know the actual sales figures, we would need to consult the data provided by the affiliate platform or have a legitimate and compatible integration.
And in a local business, someone can call directly from the Google Business Profile without going through the website. That contact won't automatically appear in our site's GA4 events.
The important thing is to define actions based on the reality of the business, not to artificially adapt the business to the available statistics.
Once we have decided what we want to measure, we must ensure that Analytics receives the corresponding event.
This order is important. It's not very useful to mark as a key event an action that our page isn't yet recording.
For a basic setup, we can follow this procedure:
Step 1. Check that the event exists.
Access the GA4 property and review the events being collected. If you want to measure successful form submissions, first check that an event is associated with that action.
If it's not already there, you'll need to implement it using the appropriate method for your website. This could be an integration with your platform, Google Tag Manager, or a custom implementation.
Step 2. Check when it activates.
Before marking it as important, run a real-world test. Verify that the event is sent when the action is completed successfully and that it isn't triggered accidentally when the page loads, the form opens, or a button is clicked that ends up displaying a validation message.
This check can be done with DebugView and the corresponding debugging tools.
Step 3. Mark it as a key event.
From the GA4 administration panel, look for the Events or Key Events section. There you can identify the event you want to highlight and mark it as a key event. The exact location of the controls may vary with interface updates and depending on your permissions.
Step 4. Check its appearance in the reports.
Perform a new test action and verify that the event is logged correctly. Then, consult the relevant reports to analyze its evolution.
Keep in mind that standard reports may require processing time; DebugView is more appropriate for immediately checking an implementation.
You can consult the official Google Analytics key events instructions to review the updated procedure and concepts.
The first is to measure the click instead of the result. As we've mentioned, clicking "Submit" doesn't guarantee that the form has been sent. If you use that click as an indicator of received requests, you could be counting nonexistent contacts.
The second is registering the same action multiple times. This happens, for example, when an event is triggered by Google Tag Manager and also by an integration installed in WordPress. In other cases, a poorly configured thank-you page allows the user to reload it, generating duplicate registrations.
The third mistake is choosing overly generic actions as indicators of business success. If you mark all page views as key events, you'll end up seeing very high numbers, but you won't know how many visitors have actually done something meaningful.
The solution involves designing a simple measurement, checking when events are triggered, and clearly differentiating between interaction indicators and results.
You already know how to record important events. Now comes the part that turns all those statistics into useful information for decision-making.
Because knowing that we have obtained 40 contact requests during a month may be interesting, but the figure acquires much more meaning when we relate it to the traffic, its origin, the cost of acquisition and the quality of the contacts.
Let's imagine two situations.
The first company receives 10.000 sessions and gets 30 quote requests. The second receives 2.500 sessions and gets 45 requests.
Which one is working better?
If we only look at visits, the first option wins. If we look at inquiries, the second option wins. But we still need to study how many inquiries correspond to actual leads and how many end up becoming sales.
That's the difference between measuring activity and analyzing the performance of a business.
One particularly useful metric is the key event rate, which can be calculated per user or per session, depending on the report we are using.
The session key event rate represents the percentage of sessions during which at least one key event of the selected type was recorded.
For example, if a website registers 2.000 sessions and in 60 of them a key event of requesting a quote occurs, the corresponding rate would be 3%.

It's important to understand that we're counting sessions that have registered the event, not necessarily the total number of times it has been triggered. If the same user submits three forms during a session, that doesn't equate to three distinct sessions with a key event.
In addition, there is a user-calculated rate, which answers a different question: what percentage of users have registered at least one of those events.
Therefore, when someone talks about a 3% conversion rate, it's advisable to check what definition they are using before comparing results.
Modify the example figures to see how the percentage changes.
The calculation corresponds to a specific key event and uses sessions, not individual events or users.
So, what rate should a website achieve to be considered to be functioning correctly?
There is no one-size-fits-all answer. Rates vary enormously depending on the industry, traffic type, offer, price, visitor intent, and the objective being measured.
It makes no sense to directly compare a €15 purchase with hiring a professional service costing several thousand euros. Nor does it make sense to compare a free newsletter subscription with a request for a quote.
Instead of obsessing over achieving a supposed perfect percentage, it is advisable to establish an initial reference point and study how it evolves over time.
If your website has recorded conversion rates of 1,5%, 1,7%, and 1,6% over three months, you likely have a useful benchmark of its typical performance. From there, you can investigate which changes help improve results and which don't produce the desired effect.
However, when working with small volumes, percentage variations can be quite striking without being statistically significant. Going from two to four requests means doubling the number of contacts, but the absolute difference remains at two.
Let's retrieve the traffic acquisition report we used earlier.
Let's say a company receives traffic from Google, social media, and advertising campaigns. If we've correctly configured a key event for quote requests, we can analyze which channels contribute to generating those leads.
Let's look at this fictional example:
Canal | Sessions | Sessions with request | Rate per session |
|---|---|---|---|
Organic Search | 2000 | 60 | 3% |
Paid search | 1000 | 45 | 4,5% |
Organic Social | 1500 | 15 | 1% |
Referral | 500 | 20 | 4% |
At first glance, Paid Search has the highest rate of sessions with a request, although Organic Search generates more contacts in absolute terms.
Does that mean we should invest the entire budget in advertising?
Not necessarily. To assess profitability, we would need to know how much it costs us to acquire traffic through each strategy, how many leads are truly valuable, and what percentage ultimately becomes a customer.
Furthermore, the attribution of key events can distribute credit across different channels depending on the model configured in GA4. For this reason, it is not always appropriate to equate the attributed distribution of key events with a count of unique contacts originating exclusively from one channel.
In other words, Analytics can help us evaluate the contribution of each channel, but we need to know the rules by which it is presenting that information.
If you manage Google Ads campaigns, this relationship between acquisition, key events, and results is especially important. A campaign can generate many cheap clicks and still be unprofitable if it barely acquires any customers.
Here it is advisable to take a further step and temporarily exit the Analytics panel.
Imagine a company that invests €600 per month in advertising and receives 30 quote requests attributable to that campaign. After reviewing the contacts, it discovers that 20 are valid business opportunities and ultimately acquires five clients.
With that data we can calculate:
Indicator | Result |
|---|---|
Advertising investment | 600 € |
Requests received | 30 |
Cost per application | 20 € |
Qualified contacts | 20 |
Cost per qualified contact | 30 € |
Clients acquired | 5 |
Advertising acquisition cost per customer | 120 € |
This example demonstrates why we shouldn't focus on the number of applications.
If each new customer generates a contribution margin of €500, after considering the direct costs of the service, an advertising investment of €120 per customer could be worthwhile. However, if the margin were only €70, the scenario would be very different.
To determine the true profitability, it would also be necessary to consider other costs such as customer acquisition, tools, personnel and management, as well as the economic value that each customer brings.
And here's where an important limitation comes in: Google Analytics 4 doesn't always have all the information needed to calculate your business's profitability.
A well-configured e-commerce platform can record purchases and revenue. In a service company, however, hiring usually occurs after several calls, meetings, or email exchanges.
To connect these results with digital campaigns, it may be necessary to use a CRM, business information, and additional measurement implementation, always respecting privacy and data processing requirements.
The good news is that you don't need to set up a sophisticated system from day one. You can start by accurately measuring requests and comparing them with an internal customer database.
The key is to avoid confusing website statistics with actual billing.
Another of GA4's most useful applications is investigating what happens between the moment someone shows interest in your offer and the moment they should complete an action.
Let's think about an online store.
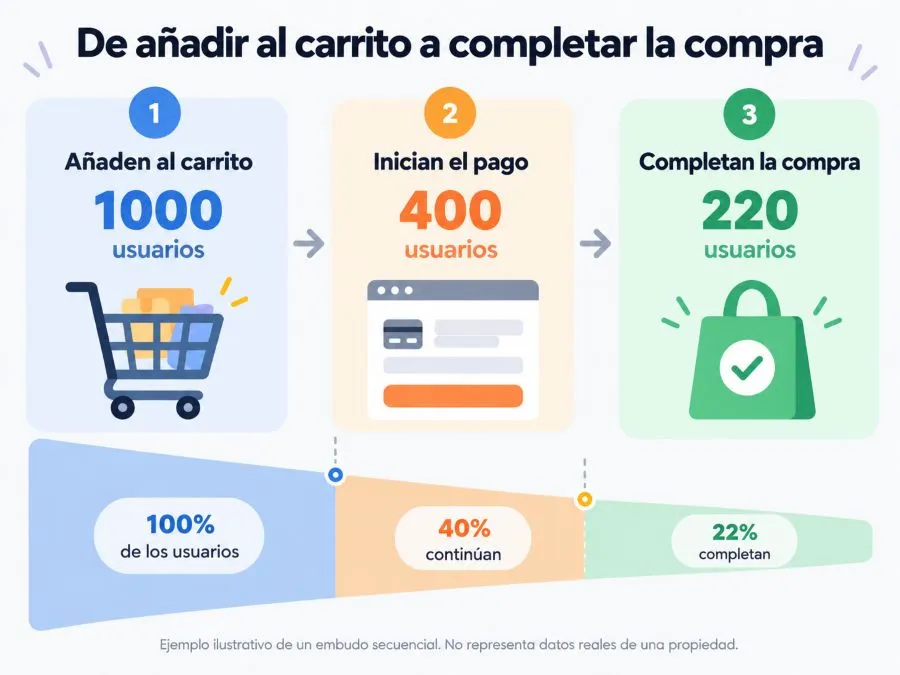
During the last month, 1.000 users have added products to their cart, 400 have started the checkout process, and 220 have completed the purchase.
This allows us to observe that there is a considerable reduction in time between adding a product and starting the checkout process. Users are also lost during the purchase process.
However, to rigorously analyze these steps we need to work with consistent definitions and metrics, preferably through a funnel exploration configured for the journey we want to study.
A funnel report allows you to represent the stages that users must go through and observe how many advance or drop out at each stage.
In a service company we can also build a similar journey: arrival at a commercial page, visit to the form and successful submission of the request.
If many people reach the form, but barely complete it, we may be asking for too much data, there may be a usability problem, or the proposal may not convey enough confidence.
It could also be that the form works perfectly and we are simply attracting uninterested visitors.
That's why data should be used to formulate hypotheses, not to automatically point the finger at culprits.
A well-planned improvement involves identifying a problem, proposing an explanation, implementing a change, and measuring its effect. If the volume and conditions allow, we can use controlled experiments to determine which of several alternatives works best.
This is how analytics stops being a report we look at once a month and becomes an optimization tool.
Before we finish this section, there's a question that often raises a lot of doubts: why does Google Analytics indicate 20 key events and your CRM, Google Ads, or WooCommerce show a different number?
The first reaction is usually to think that some tool is malfunctioning. And while configuration problems do exist, discrepancies don't always indicate an error.
Each platform may use different criteria to record, attribute, and present its results.
For example, a purchase made in WooCommerce may be recorded in the order system, while its corresponding event does not reach Google Analytics because the user has rejected tracking, a blocker prevents the sending, or there is an implementation failure.
It is also possible for a Google Ads campaign to receive credit for a conversion that Analytics attributes differently, depending on the attribution models and measurement windows set up.
In certain circumstances, GA4 uses statistical modeling to estimate key events that cannot be directly observed. This should also be taken into account when comparing results.
Common causes of discrepancies include:
Different attribution models and windows.
Consent restrictions and blockers.
Duplicate or misconfigured events.
Time zone differences.
Different criteria for counting users, sessions, and actions.
Delays in information processing.
Cancellations and returns that are not reflected correctly in the measurement.
In an e-commerce business, the order system should remain the primary source for understanding actual sales. Analytics provides insights into order acquisition and past user behavior, but it shouldn't replace accounting or the transactional system.
Something similar happens in a service company: CRM and business records allow us to know how many customers we have actually acquired, while GA4 helps to understand which digital actions contributed to generating them.
When both sources are used together, we obtain a much more complete view of business activity.
And if the discrepancies are too significant, it's worth conducting an implementation audit. An analytics system that inaccurately records results can lead to increased investment in underperforming campaigns or the dismissal of channels that are generating revenue.
There's something far worse than not having Google Analytics 4 installed: having it malfunctioning and blindly trusting its results. Because when we're not measuring anything, at least we know we're missing information. But when we consult incorrect data without realizing it, we can end up making decisions that harm our business.
And the curious thing is that many GA4 errors don't come with a huge red warning. The tool can display perfectly normal graphs, numbers that seem reasonable, and percentages that change every week, even though behind the scenes we might be duplicating visits, registering forms that were never submitted, or attributing traffic to the wrong channels.
This can happen relatively easily on a WordPress site that's been through several hands. A developer installs Analytics using code, someone later adds a plugin to connect it, and months later, Google Tag Manager is set up to manage advertising campaigns. No one checks which tags are still working, and we end up with several overlapping implementations.
There are also less technical, but equally important, errors: interpreting an increase in users as an automatic improvement in the business, comparing metrics that do not represent the same thing, or assuming that all recorded events are conversions.
Therefore, before using Google Analytics 4 reports to decide where to invest, what content to update, or which campaigns to maintain, it is advisable to ensure that we are working with reliable measurement.
Let's review the most common mistakes, how to identify them, and what we should do to correct them.
This is one of the most frequent errors in GA4 installations, especially on pages developed with WordPress.
Imagine your site already has the Analytics tag installed using Google Tag Manager. A few months later, you install Site Kit to access Google data from the WordPress dashboard and also enable tag insertion.
If both systems send the same event page_view For the same property, you could register two views per page load.
The problem isn't using Site Kit and Tag Manager simultaneously. Both tools can coexist. The problem arises when their configurations cause duplicate information to be sent.
And this has direct consequences for your reports.
A page that actually generated 500 views may end up showing a considerably higher number. Event counts and certain engagement metrics may also be altered, although users and sessions may not necessarily double in the same proportion.
How to detect the problem: Use Google Tag Assistant to review which tags are running, and then check in DebugView the events that GA4 receives during a test navigation.
If you observe two events when loading a page page_view When you were only expecting one, it's worth investigating. Keep in mind that certain single-page application implementations or history changes can also generate pageview events, so not every additional record indicates incorrect duplication.
How to fix it: Identify all existing integrations and establish a single sending system for each event you want to measure. Don't remove tags without first checking their function, as some may be necessary for Google Ads or other services.
In projects with multiple integrations, documenting which tool manages each measurement avoids many subsequent problems.
Installing Google Analytics does not guarantee that your website is measuring business objectives.
You can have users, sessions, and page views perfectly configured, but lack information about the contacts you receive. And the opposite can also happen: you might think you're measuring quote requests when in reality you're only recording button clicks.
Let's take an example. A company uses a contact form developed with Elementor. Someone configures an event to trigger every time the visitor clicks "Submit".
The problem is that the form contains required fields. If someone tries to submit it without entering their email address, the system may display an error message. However, the event associated with the click has already been logged.
According to Google Analytics, based on that faulty implementation, it might appear as a contact request. For the company, absolutely nothing has been received.
If this behavior is repeated throughout the month, the reports may show many more business opportunities than actually exist.
The correct approach is to measure submission confirmation, not just button clicks. Depending on the form technology, this can be achieved through a success event, a compatible integration, or a properly implemented thank-you page.
How to check: Run three different tests. Submit the form correctly, try submitting it with invalid fields, and see what happens if you submit it twice. Then, review the logged events using DebugView.
The configuration should clearly distinguish between situations.
This check is especially important when contact events are used to optimize advertising campaigns. If Google Ads receives conversion signals that represent failed attempts, it may end up optimizing for actions that don't generate actual leads.
There is a fairly common scene when a new website is launched: everyone wants to see it.
The owner logs in several times to check the texts, the designer reviews the changes, the marketing manager consults different pages, and someone from the sales team visits the portfolio to show it to a client.
If all those visits are recorded as normal traffic, they can skew the statistics.
On a website with tens of thousands of monthly visits, their influence might be limited. However, on a corporate website that receives 200 or 300 sessions per month, team visits can represent a considerable portion of the activity.
This is especially problematic when testing forms, contact buttons, or purchase processes.
Google Analytics 4 allows you to identify internal traffic using conditions based on IP addresses and use data filters to exclude it from processing.
But be especially careful here: an activated exclusion filter can permanently delete data. Google explicitly warns that data filters do not modify history and that events excluded by active filters cannot be recovered later in Analytics.
Therefore, before activating a permanent exclusion, it is advisable to review the conditions, use the trial status when available, and ensure that we are not filtering legitimate traffic.
In companies where employees use mobile networks, home connections, or dynamic IP addresses, a simple IP list may not be sufficient.
The solution must be adapted to the way each organization works.
This problem deserves special attention because it affects both data quality and compliance with privacy regulations.
Incorrect implementation of consent can lead to very different situations.
On some pages, Google Analytics starts using analytics identifiers before the visitor has given the necessary consent. On others, the tag remains permanently blocked, even after accepting cookies. There are also configurations where the consent status is not properly communicated to the tags.
None of these scenarios are desirable.
For a website targeting a Spanish audience, simply installing a cookie banner and assuming everything is resolved is not enough. It's necessary to review which technologies are being used, what information is provided to the visitor, how their choice is recorded, and what happens when they accept, reject, or modify their consent.
Google Consent Mode allows you to communicate consent states to Google tags, but it does not replace legal obligations or automatically make an implementation compliant with the GDPR and applicable Spanish regulations.
From an analytics perspective, we must also assume that we won't always be able to observe all actual visitor activity. Ad blockers, browser restrictions, and consent decisions can lead to discrepancies between what happens on the website and what appears in reports.
Therefore, the fact that Analytics registers fewer users than other tools does not necessarily mean that it is malfunctioning.
What to check: Verify the behavior of the tags before, after, and after accepting cookies. Repeat the test in a new session, preferably using debugging tools, and verify that the consent signals are updated correctly.
The goal is not to have GA4 record every visit at any cost. It's to have a technically sound measurement system that respects applicable privacy regulations.
We already mentioned this when explaining acquisition channels, but it's such a common mistake that it deserves to be repeated.
When a company observes that Direct traffic has increased by 40%, it can interpret this as meaning that more and more people are remembering their domain and typing it directly into the browser.
It's a possibility, but not the only one.
GA4 may classify as direct traffic traffic whose source it cannot adequately identify. This can happen with certain shared links in applications, documents, private communications, or situations where reference information is lost.
Incorrect campaign settings and UTM parameters can also have an impact.
Imagine you send a promotion via WhatsApp to your customers and notice an immediate increase in direct traffic. If the links aren't properly tagged and the source isn't being tracked in Analytics, you could mistakenly attribute that growth to brand awareness.
Before celebrating success, we should study when the increase occurred, which pages received those sessions, and what marketing actions were carried out during that period.
For in-house campaigns that require tracking, using UTM parameters correctly can help reduce these ambiguities.
The conclusion is simple: Direct does not exclusively mean that someone has written your web address by hand.
This error appears especially in ecommerce, booking platforms and pages that use external services to complete certain actions.
Imagine an online store where the user selects a product in mitienda.esHowever, the payment process ends on a different domain. After completing the transaction, it returns to the store.
If the measurement is not properly designed, Analytics could misinterpret parts of that journey or attribute the activity to a referrer that does not truly represent the user's business origin.
For certain cases, GA4 has multi-domain measurement configuration and options to identify unwanted references.
But these functions are not interchangeable.
Multi-domain measurement aims to maintain continuity of identification and sessions across related domains when the necessary conditions are met. Configuring unwanted referrals prevents attributing referred traffic to specific domains, but it does not, on its own, resolve all cross-site identification issues.
Therefore, if your purchase process uses multiple domains, it's advisable to review the entire journey using debugging tools.
It is not enough to verify that Analytics works on the homepage: we also need to verify what happens when the user temporarily leaves our domain and returns.
For an online store, one of the worst mistakes is believing that Analytics measures sales because it already records visits to product pages.
Ecommerce measurement needs to implement specific events and send the corresponding information for each transaction.
For instance, purchase It represents a completed purchase and can incorporate parameters such as the transaction identifier, currency, value, and items purchased.
This data must accurately reflect what happened in the store.
If a purchase is recorded twice, if the amount includes items different from what you expected, or if returns are not properly reported, revenue reports can be misleading.
We also need to be careful with thank-you pages. If the purchase event is triggered uncontrollably every time that page loads, we could generate duplicate registrations.
The solution is to design an implementation that uses appropriate transaction identifiers, controls sent events, and includes return and cancellation processes where applicable.
Afterwards, it is advisable to periodically compare the GA4 results with the ecommerce orders, investigating the significant differences without expecting them to necessarily coincide one hundred percent.
In WordPress, WooCommerce records orders within its own system. Analytics, on the other hand, relies on measurement events being sent and processed correctly.
If a customer declines tracking, uses certain blockers, or leaves the page before an event is sent from the browser, a purchase may exist in WooCommerce without appearing in Analytics.
It is also possible that both systems use different definitions of income, taxes, shipping costs, and returns.
Therefore, the goal of analytics should not be to replace order recording, but to better understand how sales occur and which channels contribute to them.
To verify the implementation of an ecommerce system, it is recommended to place test orders and verify the data transmitted in each event, ensuring that these tests do not contaminate the production reports.

This is one of those settings that goes completely unnoticed until you try to access old information and discover that it is no longer available.
Google Analytics 4 allows you to set how long to retain certain user and event-level data. For standard properties, the default retention period is two months and can be extended to fourteen months.
Does this mean that after two months all your website statistics disappear? No. And here's the important distinction.
The retention settings primarily affect data used in more detailed analyses, such as scans. Standard aggregated reports are not subject to this same retention period.
The problem arises when you want to study user journeys or create custom analyses with data from several months ago and discover that the necessary information has already been deleted.
How to avoid it: Check the "Data Retention" section within your property management and select a period that suits your needs, while respecting your privacy obligations.
If you need to perform analyses that cover several months, it may be advisable to extend the retention period to fourteen months where appropriate. You must do this before the data is deleted, because extending the period afterward will not recover information that has already been deleted.
This small adjustment can save you a lot of trouble when you start using GA4's advanced scans.
We ended up with an error that doesn't depend on a poorly installed tag or a forgotten setting. It depends on how we interpret the information.
Google Analytics 4 is a very complete measurement tool, but it is not a system capable of accurately recording everything that happens on a website.
Your reports may be affected by consent restrictions, blockers, statistical estimates, privacy thresholds, or sampling processes, depending on the type of query and the characteristics of the property.
In certain circumstances, Google also groups infrequent values within a row called (other)especially when there are many combinations of dimensions.
Therefore, before interpreting an unexpected difference, it's advisable to review the data quality indicator that appears in the reports and explorations. This element allows you to check whether certain limitations have been applied to the displayed result.
Imagine that a services page usually receives about 300 weekly sessions and, suddenly, you notice that visits have dropped by half.
This could be due to a loss of organic ranking, a campaign that has ended, or a technical issue with measurement. It could also be related to a change in cookie consent.
Before modifying your marketing strategy, you should check which channels have registered the drop, when it started, whether events are still arriving correctly, and what information other tools, such as Google Search Console, show.
The same caution should be applied to percentages.
If a website goes from two leads to four, it has increased its inquiries by 100%. That's positive growth, but we're still talking about two additional leads. Drawing major business conclusions from such small samples can be premature.
Therefore, a good practice is to compare sufficiently representative periods and contextualize the changes with the actions taken during those dates.
Data is useful when we know how to interpret it. Otherwise, it can become a rather sophisticated way to make mistakes.
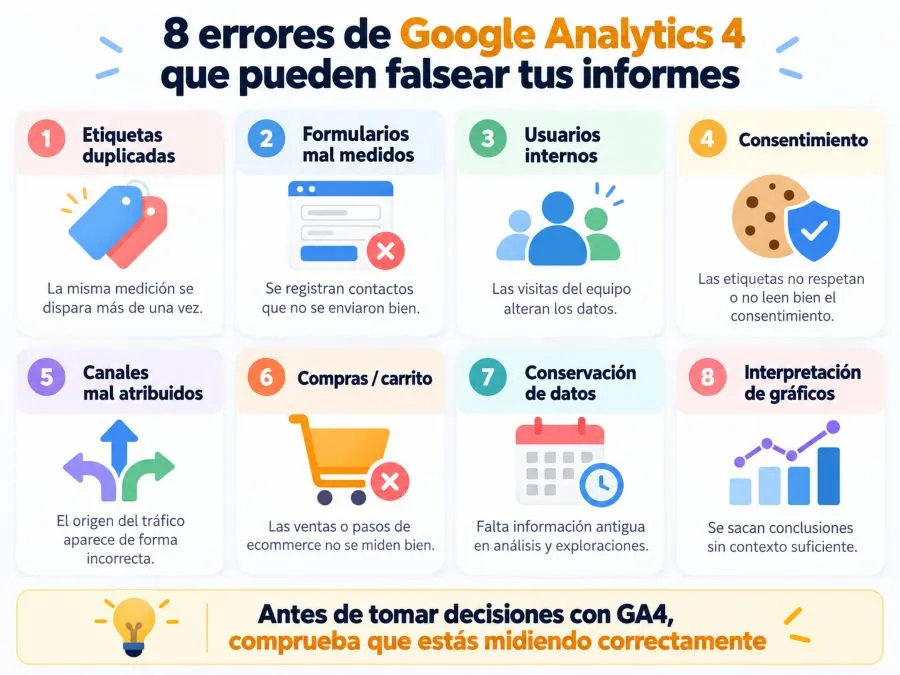
Once you've learned how to navigate Google Analytics 4, it's time to integrate it into your regular website management. But be careful: you don't need to log in every day to check if you've had fifteen more visits than yesterday. That might be fun for the first week, but it rarely helps you make better decisions.
For most small businesses, a well-organized monthly review provides far more value than constantly checking statistics without a clear objective. The key is to identify trends, check if marketing efforts are working, and discover which aspects of the website need attention.
That doesn't mean you should wait a month to detect a major problem. If you've just launched an advertising campaign, modified a form, or installed new labels, you should test how they work immediately. The monthly review is for evaluating results, not for replacing technical checks.
Although GA4 offers numerous possibilities, you can start with a routine of five reports. It's recommended to always select the same period and compare it with the previous month or, when there is sufficient historical data, with the same month of the previous year.
Report | What to check | What you can discover |
|---|---|---|
Report summary | Users, sessions and overall evolution | Whether activity is increasing or decreasing |
Traffic acquisition | Channels, sessions, and interaction | What sources attract relevant visitors? |
landing pages | Entry and performance pages | What content attracts traffic |
Pages and screens | Visualizations and interaction | What content sparks interest |
key events | Important actions and their evolution | If the website is meeting its objectives |
The names and availability of the reports may vary depending on the property configuration, but these five perspectives provide a good starting point.
The most important thing is that you don't need to study every metric with the same depth. If you have a corporate website whose goal is to receive quote requests, you'll probably dedicate more attention to services pages, acquisition channels, and contact events than to file downloads.
In an ecommerce business, however, the analysis of purchases, products, and revenue will play a more prominent role.
For analytics to be useful, it's best to make it a simple routine. Imagine setting aside twenty minutes on the first Monday of each month to review your website's performance.
You can organize that time in the following way:
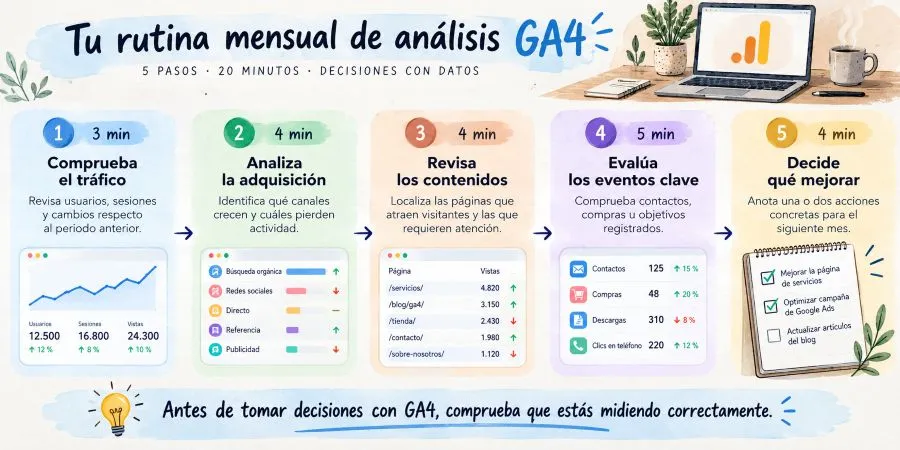
This review is not intended to replace a professional analysis, but it does help to identify important changes.
For example, if you discover that organic traffic has declined for two consecutive months, you can go to Google Search Console to investigate whether impressions or clicks from Google have also fallen.
If a services page receives many visits but generates few leads, it may be time to review its content, form, or call to action.
And if an advertising campaign is attracting visitors who aren't taking any relevant action, you'll need to study the targeting, the ad message, and the landing page before increasing your investment.
The key is to end each review with some useful conclusion, even if it's as simple as keeping what's working and observing a trend for another month.
Google Analytics allows you to modify the date range and compare it to another period. This feature is essential for detecting changes, but it can also lead to hasty conclusions.
Imagine a gift shop comparing its December sales to its January sales. It's very likely they'll find a significant drop after the holiday season. However, that doesn't necessarily mean their strategy has failed; they could simply be observing perfectly normal seasonal behavior.
Therefore, whenever possible, it is advisable to complement the comparison with the previous month with a review of the same period of the previous year.
We must also consider the circumstances of the business. A newly launched advertising campaign, a major website update, a special promotion, or a temporary availability issue can explain some of the variations.
And, of course, remember that increased traffic doesn't always mean better results.
If sessions increase by 30%, but quote requests remain stable, it's worth investigating what type of visitors we're attracting and whether they truly match our company's target audience.
The real work begins when we close Analytics.
If you've identified a business page with high traffic but few inquiries, you might consider improving its value proposition. If an informative article attracts qualified visitors, it might make sense to strengthen its links to related content or services.
And if you find that one acquisition source generates customers more frequently than others, you can study how to boost it without neglecting the other channels.
A simple way to organize the findings is to use a small tracking table:
Find | possible explanation | Next action |
|---|---|---|
Organic acquisition declines | Loss of visibility or lower demand | Review Search Console |
A business website receives traffic, but few leads. | Offer, experience, or low-skilled traffic | Audit the page |
A campaign generates many clicks and few requests | Mismatch between ad and landing page | Review segmentation and message |
Qualified contacts are increasing | Potential improvement in recruitment | Analyze which channels contribute |
There's no need to introduce ten changes simultaneously. In fact, doing so would make it harder to discover which ones had a positive effect.
It is preferable to select one or two improvements, implement them, measure their results, and continue from there.
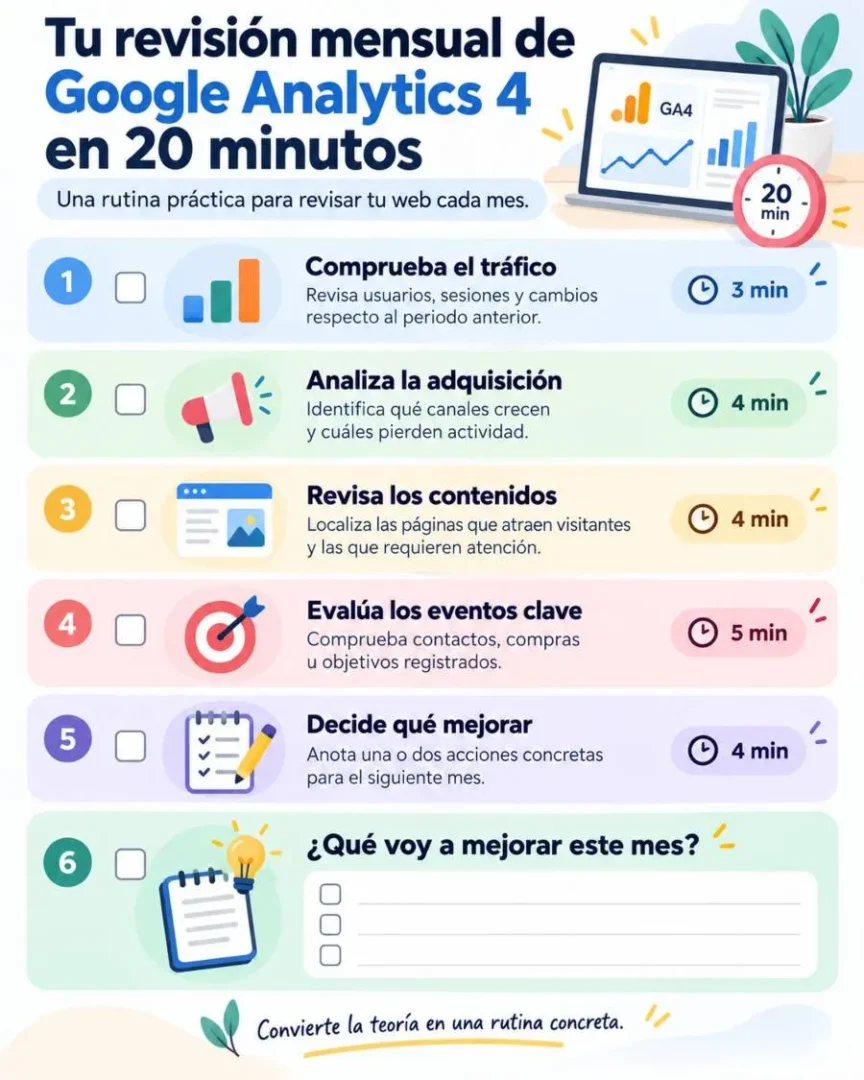
Although we already know the main functions of GA4, there are still some common questions that should be answered before you start using it. This is especially true if you're setting up Analytics for the first time or are coming from the previous version of the tool.
Yes. Google Analytics 4 has a free version that offers the main features for measurement, traffic analysis, events, and reporting.
For a small business, a blog, or most online stores, this version is usually sufficient. There's also Google Analytics 360, a paid solution geared toward organizations with more advanced analytics needs, higher spending limits, and enterprise services.
The real-time report allows you to view recent activity, while standard reports may need between 24 and 48 hours to process and stabilize certain data.
If you have just installed GA4 and statistics do not immediately appear in the usual reports, it does not necessarily mean that you have made a mistake.
To check a new installation, first use the real-time report and DebugView, instead of waiting for all reports to update.
Yes. You can integrate GA4 into WordPress using Site Kit by Google, Google Tag Manager, other compatible integrations, or a manual tag installation.
The best option depends on your project's needs. For a simple page, an official integration might be sufficient. If you need to measure forms, custom buttons, or complex business processes, you might want to consider using Tag Manager.
In any case, check that the label is not installed twice and that its operation respects the consent settings.
Google Search Console lets you see how your page appears in Google search results: impressions, clicks, queries, and average position, among other data.
Google Analytics 4 analyzes the activity recorded within the website, including users, sessions, acquisition channels, events, and results.
They are complementary tools. Search Console helps you investigate how you gain organic visibility, while Analytics lets you study what happens after visitors arrive at your page.
There are several possible explanations: users rejecting analytics cookies, tracking blockers, implementation errors, active filters, or differences between the metrics you are comparing.
It is also possible that you are comparing users with sessions or page views, which represent different concepts.
Before concluding that data is missing, review the setup, consent, and conditions under which the reports were generated.
Users represent user identities differentiated by Analytics, while sessions are periods of activity.
The same person can start multiple sessions at different times of the day or week. Therefore, the number of sessions is usually higher than the number of users.
Furthermore, GA4 cannot always recognize the same person across devices or browsers, so its figures should be interpreted taking into account identification limitations.
No. Google Analytics 4 is not designed to display the name, email address, or personal identity of each visitor.
The platform allows the study of general audience behaviors and characteristics, but its policies prohibit sending information that allows users to be personally identified, except for the exceptions and mechanisms expressly contemplated by Google.
If you need to know which people have requested information or purchased a product, you must use data obtained legitimately through your form, online store, or business management system.
Not necessarily. For a small business, reviewing key reports once a month may be enough to identify trends and evaluate results.
However, it is advisable to perform more frequent checks when advertising campaigns are launched, forms are modified, or new events are implemented.
The important thing is not to constantly consult Analytics, but to have a routine that allows you to detect problems and make decisions when necessary.
Learning to use Google Analytics 4 is not about mastering all its menus or memorizing dozens of metrics.
It involves understanding what happens on your website and using that information to make more informed decisions.
Throughout this guide we have seen how to set up GA4 from scratch, interpret its main reports, differentiate users and sessions, identify the channels that attract traffic and record the actions that really matter to a business.
We've also learned something fundamental: having data doesn't necessarily mean having useful information. A website with thousands of visits can perform worse commercially than a much smaller one, just as seemingly positive statistics can mask measurement or interpretation problems.
Therefore, our advice is to start with the essentials. Make sure Google Analytics is properly installed, identify your project goals, and get into the habit of regularly reviewing the reports related to them. You don't need to analyze absolutely everything from day one.
And when you find an interesting fact, always ask yourself one more question: what can I do with this information?
You might discover that a services page needs to improve its content, that your articles are attracting visitors who aren't very interested in hiring, or that an advertising campaign is generating higher quality leads than you thought.
That's where analytics starts to add value.
At Zudro Digital Media, we understand that a website shouldn't just be published and receive visits. It must be part of a digital strategy with clear objectives, reliable measurement, and the capacity for improvement.
Because Google Analytics 4 won't get you customers for you, but it can help you understand what you're doing well, what needs attention, and where it's worth focusing your efforts.
And that, in the end, is the difference between looking at statistics and using them to grow a business.


Related Entries